Descriptive Analytics
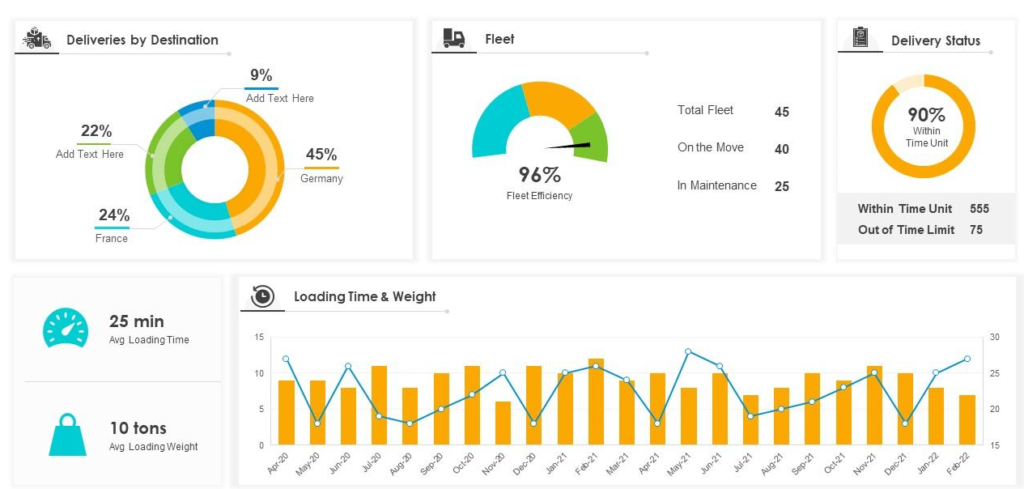
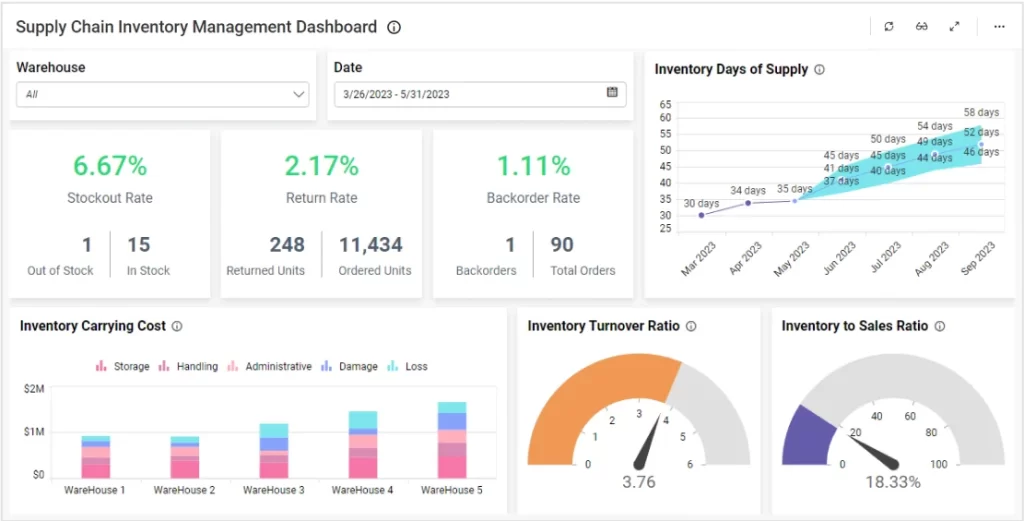
Descriptive analytics is a cornerstone of our supply chain advisory services at Patliputra Logistics, where we harness the power of historical data to gain comprehensive insights into the performance and dynamics of our clients’ supply chains. By meticulously analyzing past data related to key supply chain metrics such as inventory levels, demand patterns, lead times, transportation costs, and supplier performance, we are able to uncover valuable trends, patterns, and correlations that provide a deep understanding of our client’s supply chain operations. Our approach to descriptive analytics goes beyond merely crunching numbers; we employ advanced data visualization techniques to present complex supply chain data in a clear, visual format.
Defining & Monitoring KPI
Defining and monitoring Key Performance Indicators (KPIs) in supply chain advisory involves establishing measurable metrics to assess and track the performance of various supply chain processes. These KPIs help organizations evaluate their efficiency, identify areas for improvement, and make informed decisions to optimize their supply chain operations.


Interactive Dashboards
Interactive dashboards in supply chain advisory provide real-time visualizations of key supply chain metrics and data, enabling stakeholders to monitor performance, identify trends, and make data-driven decisions. These dashboards offer dynamic insights that enhance visibility, facilitate proactive management, and improve overall supply chain efficiency.
